 For many of you, the accuracy of the pressure transducer is going to be the most important specification. Accurate measurement is always vital to the proper function of any pressure sensor.
A pressure transducer takes a linear measurement, just like a measuring stick or a ruler. This is the natural way we think of measurement. And when we run across something that isn’t linear, we linearize it to make it usable and to improve accuracy.
Pressure sensors aren’t naturally linear. That’s because they measure stress over a surface area (diaphragm) that isn’t totally uniform. The result is a curved output that must be linearized for accuracy.
In order to linearize the curve, you first have to define your end points. Once you have done so, a straight line is drawn from your zero point to the full-scale point.
For example, if you have a 100 PSI pressure sensor with a 4-20mA output, first the sensor is told to output 4mA at 0 PSI and 20mA at 100 PSI. Once those are defined, a straight line is drawn between the end points. This is the baseline from which all deviations are measured.
From here, there are two common ways to express the deviation in the linearity on a data sheet. They are End Point Linearity, also known as Straight Line or Terminal End Point Linearity, and Best Fit Straight Line.

End Point Straight Line
With this method, the deviation is expressed by determining the difference between the natural curve and the straight line. This is done by comparing the output at a specific pressure relative to where it should be on the straight line.
For example, if we choose to compare the output at the midpoint of full scale on our 100 PSI sensor, we would look at the output at 50 PSI. This should read 12mA. But it will read something a little different. The deviation in the output is divided by the full-scale offset – which in our case would be 16 mA (20mA – 4mA = 16mA). Once you make the division, you’ll get the % of full-scale linearity.
For purposes of specification on a data sheet, the worst deviation is used for the % FS linearity spec.
While this is a simple, convenient, and intuitive method to calculate linear accuracy, it is more representative of a controlled environment instead of actual field performance.

Best Fit Straight Line (BFSL)
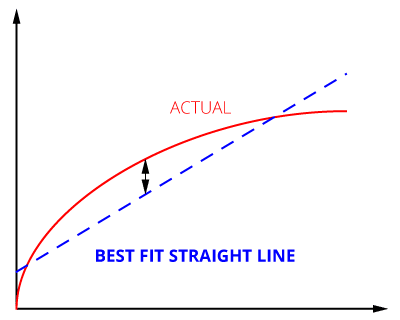
To get a better understand of real-world performance, BFSL shifts the straight line from the End Point Linearity method toward the center of the curve. This splits the difference of the output deviations.
This is the method we use to linearize our pressure transducers.
To use the BFSL method, we collect measurement data from several points as pressure increases. This is repeated at the same points as pressure falls.
Between the straight line and natural curve, the BFSL method gives you a linear accuracy with smaller deviations and a better picture of your pressure transducer’s performance in the field.
It’s All About Understanding The Spec
The accuracy of these two methods is essentially the same. The difference is in how the deviations are expressed. On top of this, there are other ways to do this – other schools of thought. But End Point Linearity and Best Fit Straight Line are the two most common methods of expressing linearity.
Contact us if you have any questions about how we specify the accuracy of our pressure sensors. We’ll help you understand how our methods compare to what you may be familiar with.
top photo credit: Biking Nikon SFO via photopin cc